# 📊 Seaborn & Matplotlib Visual Lab
Interactive Streamlit app for exploring **Seaborn** and **Matplotlib** side by side — from quick EDA plots to code snippets you can reuse in your notebooks.
This Space runs directly in the browser.
No file uploads are required: the app uses **Seaborn’s built-in demo datasets** for safe, fast experimentation.
[](https://streamlit.io/)
[](https://seaborn.pydata.org/)
[](https://matplotlib.org/)
[](https://github.com/tarekmasryo)
---
## 📌 What this app does
The Seaborn & Matplotlib Visual Lab lets you:
- Load classic **Seaborn demo datasets** (Tips, Penguins, Flights, Iris, Diamonds, Titanic, Car Crashes)
- Build **Seaborn plots** interactively (distribution, relationships, categories, heatmaps, pairplots)
- Recreate the same ideas using **Matplotlib** with more low-level control
- Compare **Seaborn vs Matplotlib** for the *same* pattern in one screen
- Save plots into a **gallery** and download them as PNG or a ZIP archive
Use it as a small **visual lab for plots**: learn, tweak, copy the code, and move it into your own projects.
---
## 📸 Dashboard Preview
### 1️⃣ Seaborn — Distribution Builder (Tips)

---
### 2️⃣ Seaborn — Relationship Builder (Tips)

---
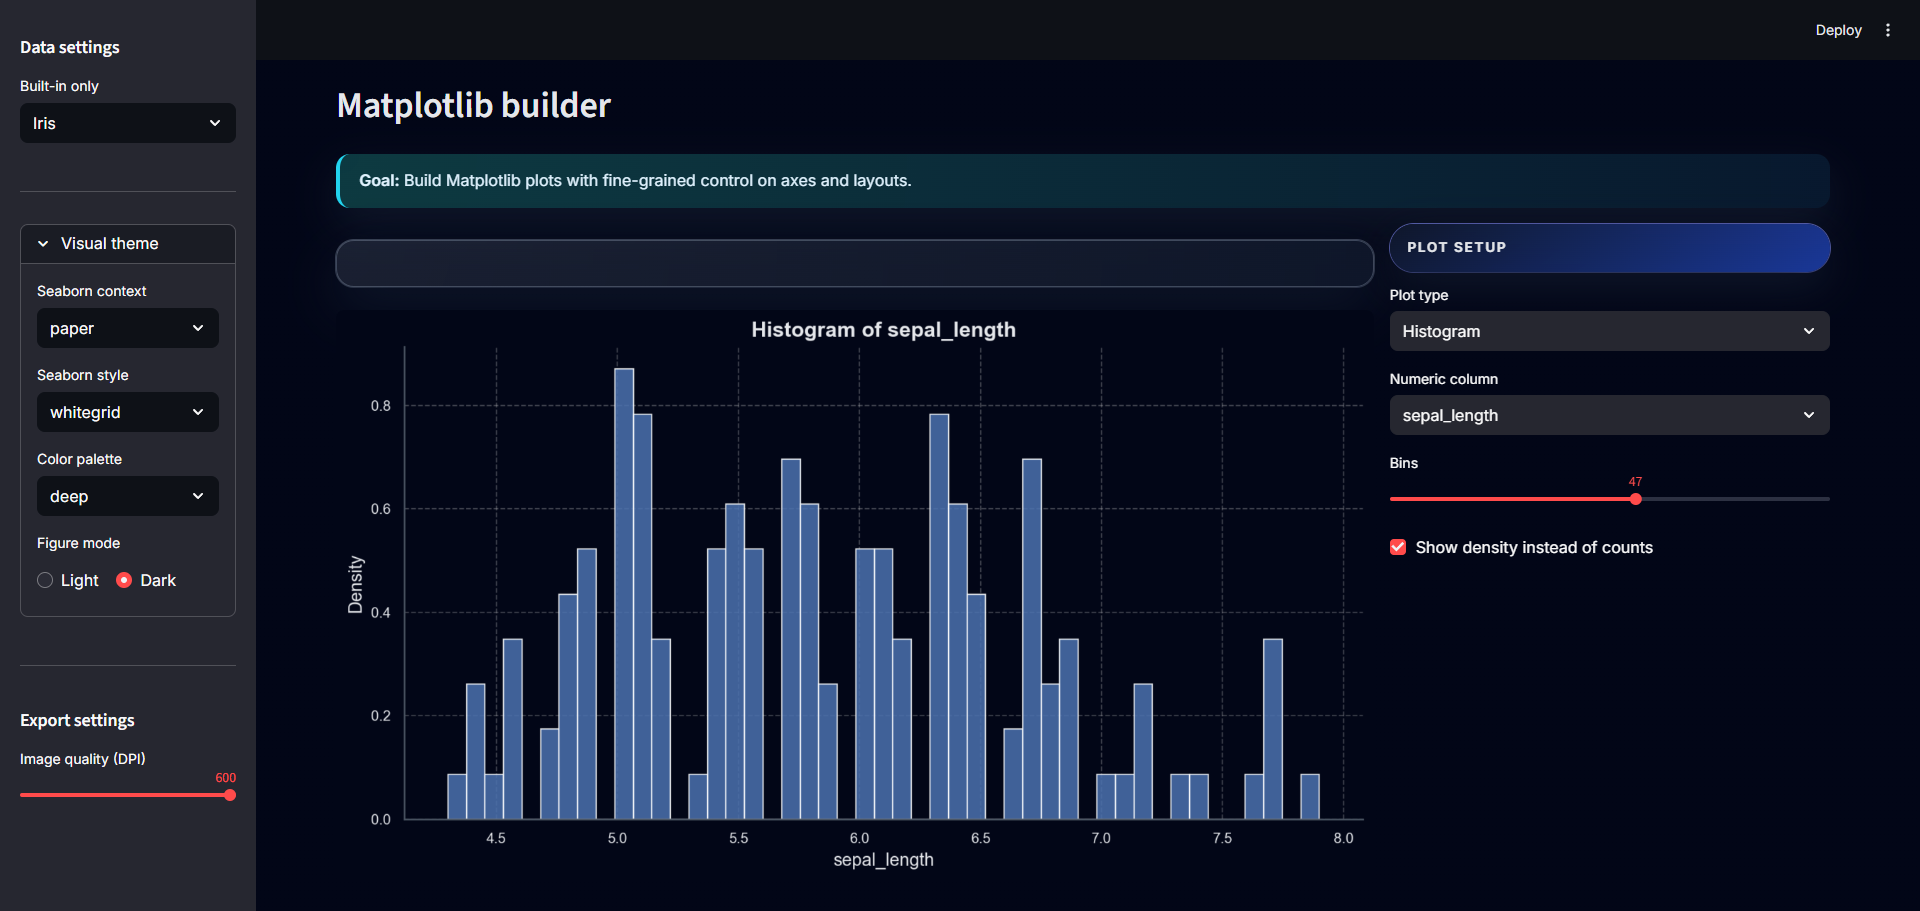
### 3️⃣ Matplotlib — Histogram (Iris)
---
### 4️⃣ Matplotlib — Line Plot (Iris)

---
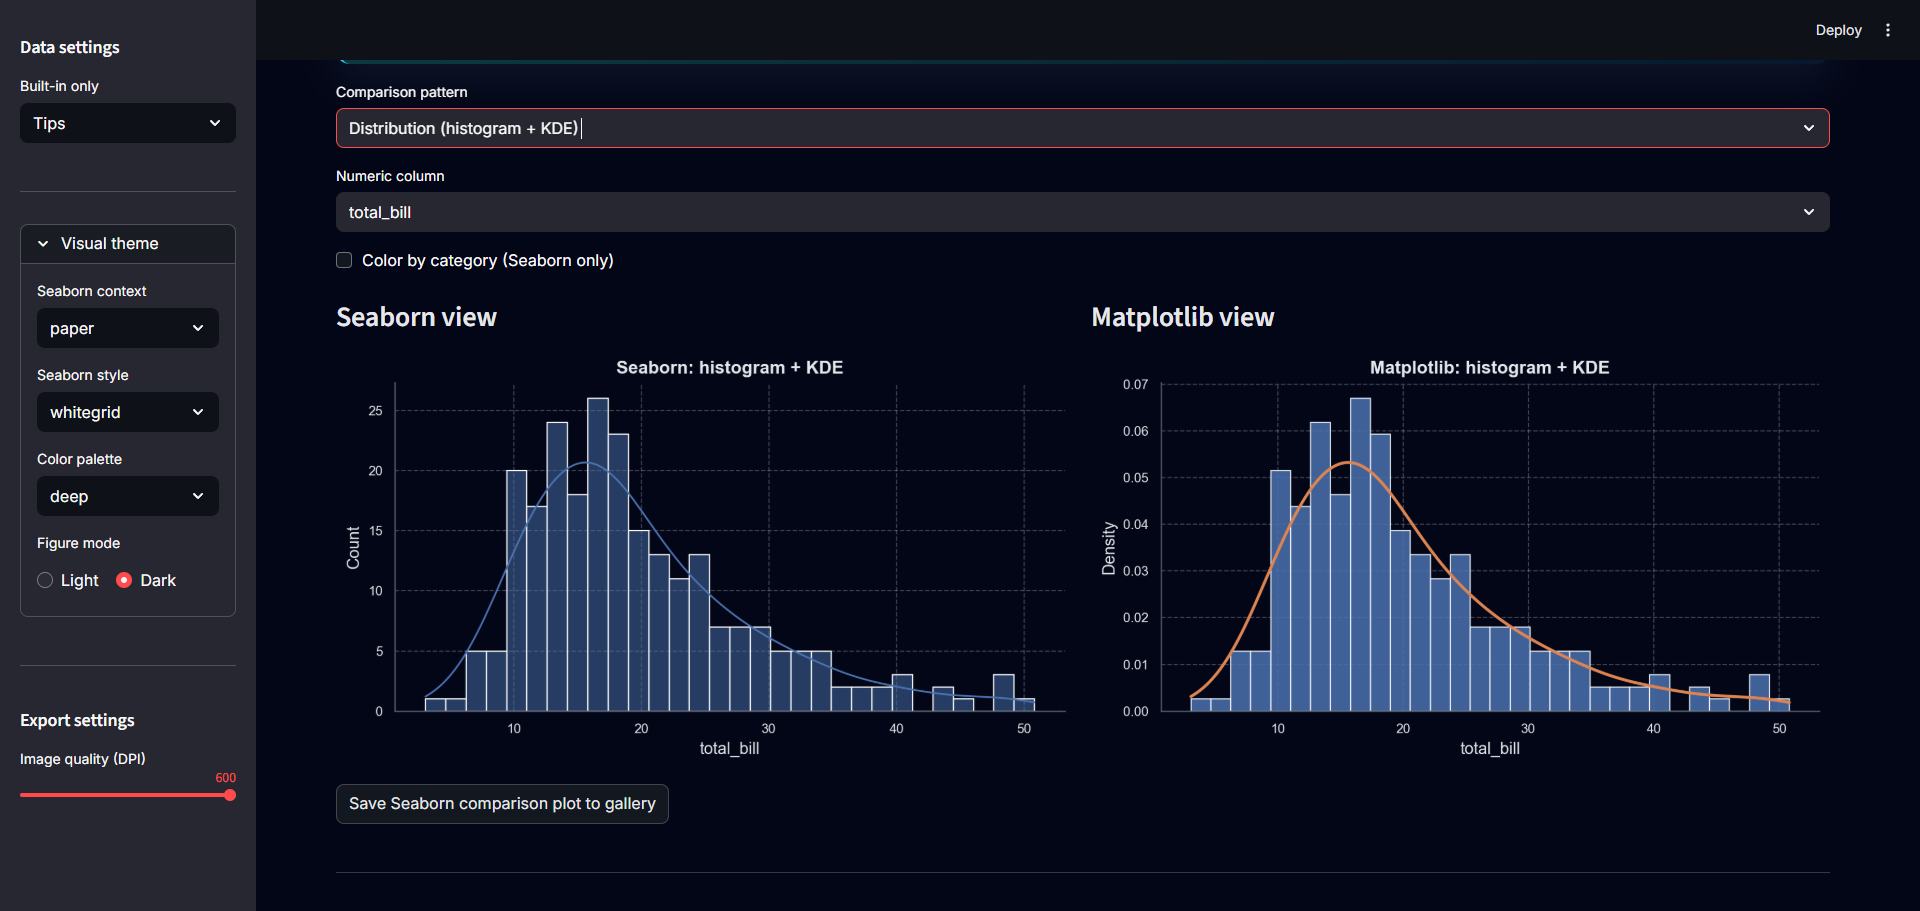
### 5️⃣ Compare — Histogram + KDE (Tips)
---
### 6️⃣ Compare — Scatter (Flights)

---
## 🧭 How to use this Space
The app is organised into five main tabs:
### 1. Overview
High-level view of the active dataset:
- Sample preview (top rows)
- Column types and missingness summary
- Quick numeric distribution
- Small correlation heatmap for a subset of numeric features
Good starting point for any dataset before plotting.
---
### 2. Seaborn builder
UI-driven Seaborn plots:
- Plot families: **Distribution, Relationship, Category, Matrix / Heatmap, Multi-variable**
- Controls for:
- Numeric / categorical column selection
- Bins, KDE, ECDF, log-scale
- Hue grouping and top-K categories
- Auto-updated **Python code snippet** that you can copy into a notebook
---
### 3. Matplotlib builder
Low-level Matplotlib plotting:
- Plot types: **Line, Scatter, Bar, Histogram, Box, Subplots overview**
- Controls for:
- Axes selection (X/Y)
- Markers, point size, transparency
- Horizontal vs vertical bars
- Density vs counts, optional KDE overlay in overview
The goal is to show how to translate visual ideas into **raw Matplotlib commands**.
---
### 4. Compare
Side-by-side comparison of Seaborn and Matplotlib for:
- **Distribution pattern:** histogram + KDE
- **Relationship pattern:** scatter plot
Useful for teaching how high-level Seaborn APIs map to Matplotlib primitives.
---
### 5. Gallery
A lightweight export hub:
- Save any Seaborn or Matplotlib plot into a session **gallery**
- Download individual PNGs
- Prepare and download a **ZIP** with all saved plots
---
## 📚 Data & Datasets
All data lives inside the Space and comes from **Seaborn’s built-in datasets**.
No uploads, no external APIs, and no personal data.
Available datasets:
- `tips`
- `penguins` (NaNs dropped)
- `flights`
- `iris`
- `diamonds` (1,000-row sample)
- `titanic`
- `car_crashes`
Switch between them from the sidebar and see the plots update instantly.
---
## 🧩 Tech Stack
- **Python**
- **Streamlit** — app framework
- **Seaborn** — high-level statistical plotting
- **Matplotlib** — core plotting engine
- **NumPy** & **pandas** — data handling
---
## 🖥 Run locally (optional)
If you want to run the same app outside Hugging Face Spaces:
```bash
git clone https://github.com/tarekmasryo/seaborn-matplotlib-visual-lab.git
cd seaborn-matplotlib-visual-lab
pip install -r requirements.txt
streamlit run app.py
```
---
Use this Space as a safe place to experiment with plots, learn the APIs, and copy production-ready snippets into your own notebooks and dashboards.